

One of the interesting questions people ask us is: "How do you guys vibe-check your embeddings?" Sure, there's MTEB for serious and quantitative evaluation on public benchmarks, but what do you do for open-domain or new problems? Today we want to share a small internal tool we use for debugging and visualization. You can call it our vibe-testing toolkit. We call it Correlations, and it's open source on GitHub.
tagDesign
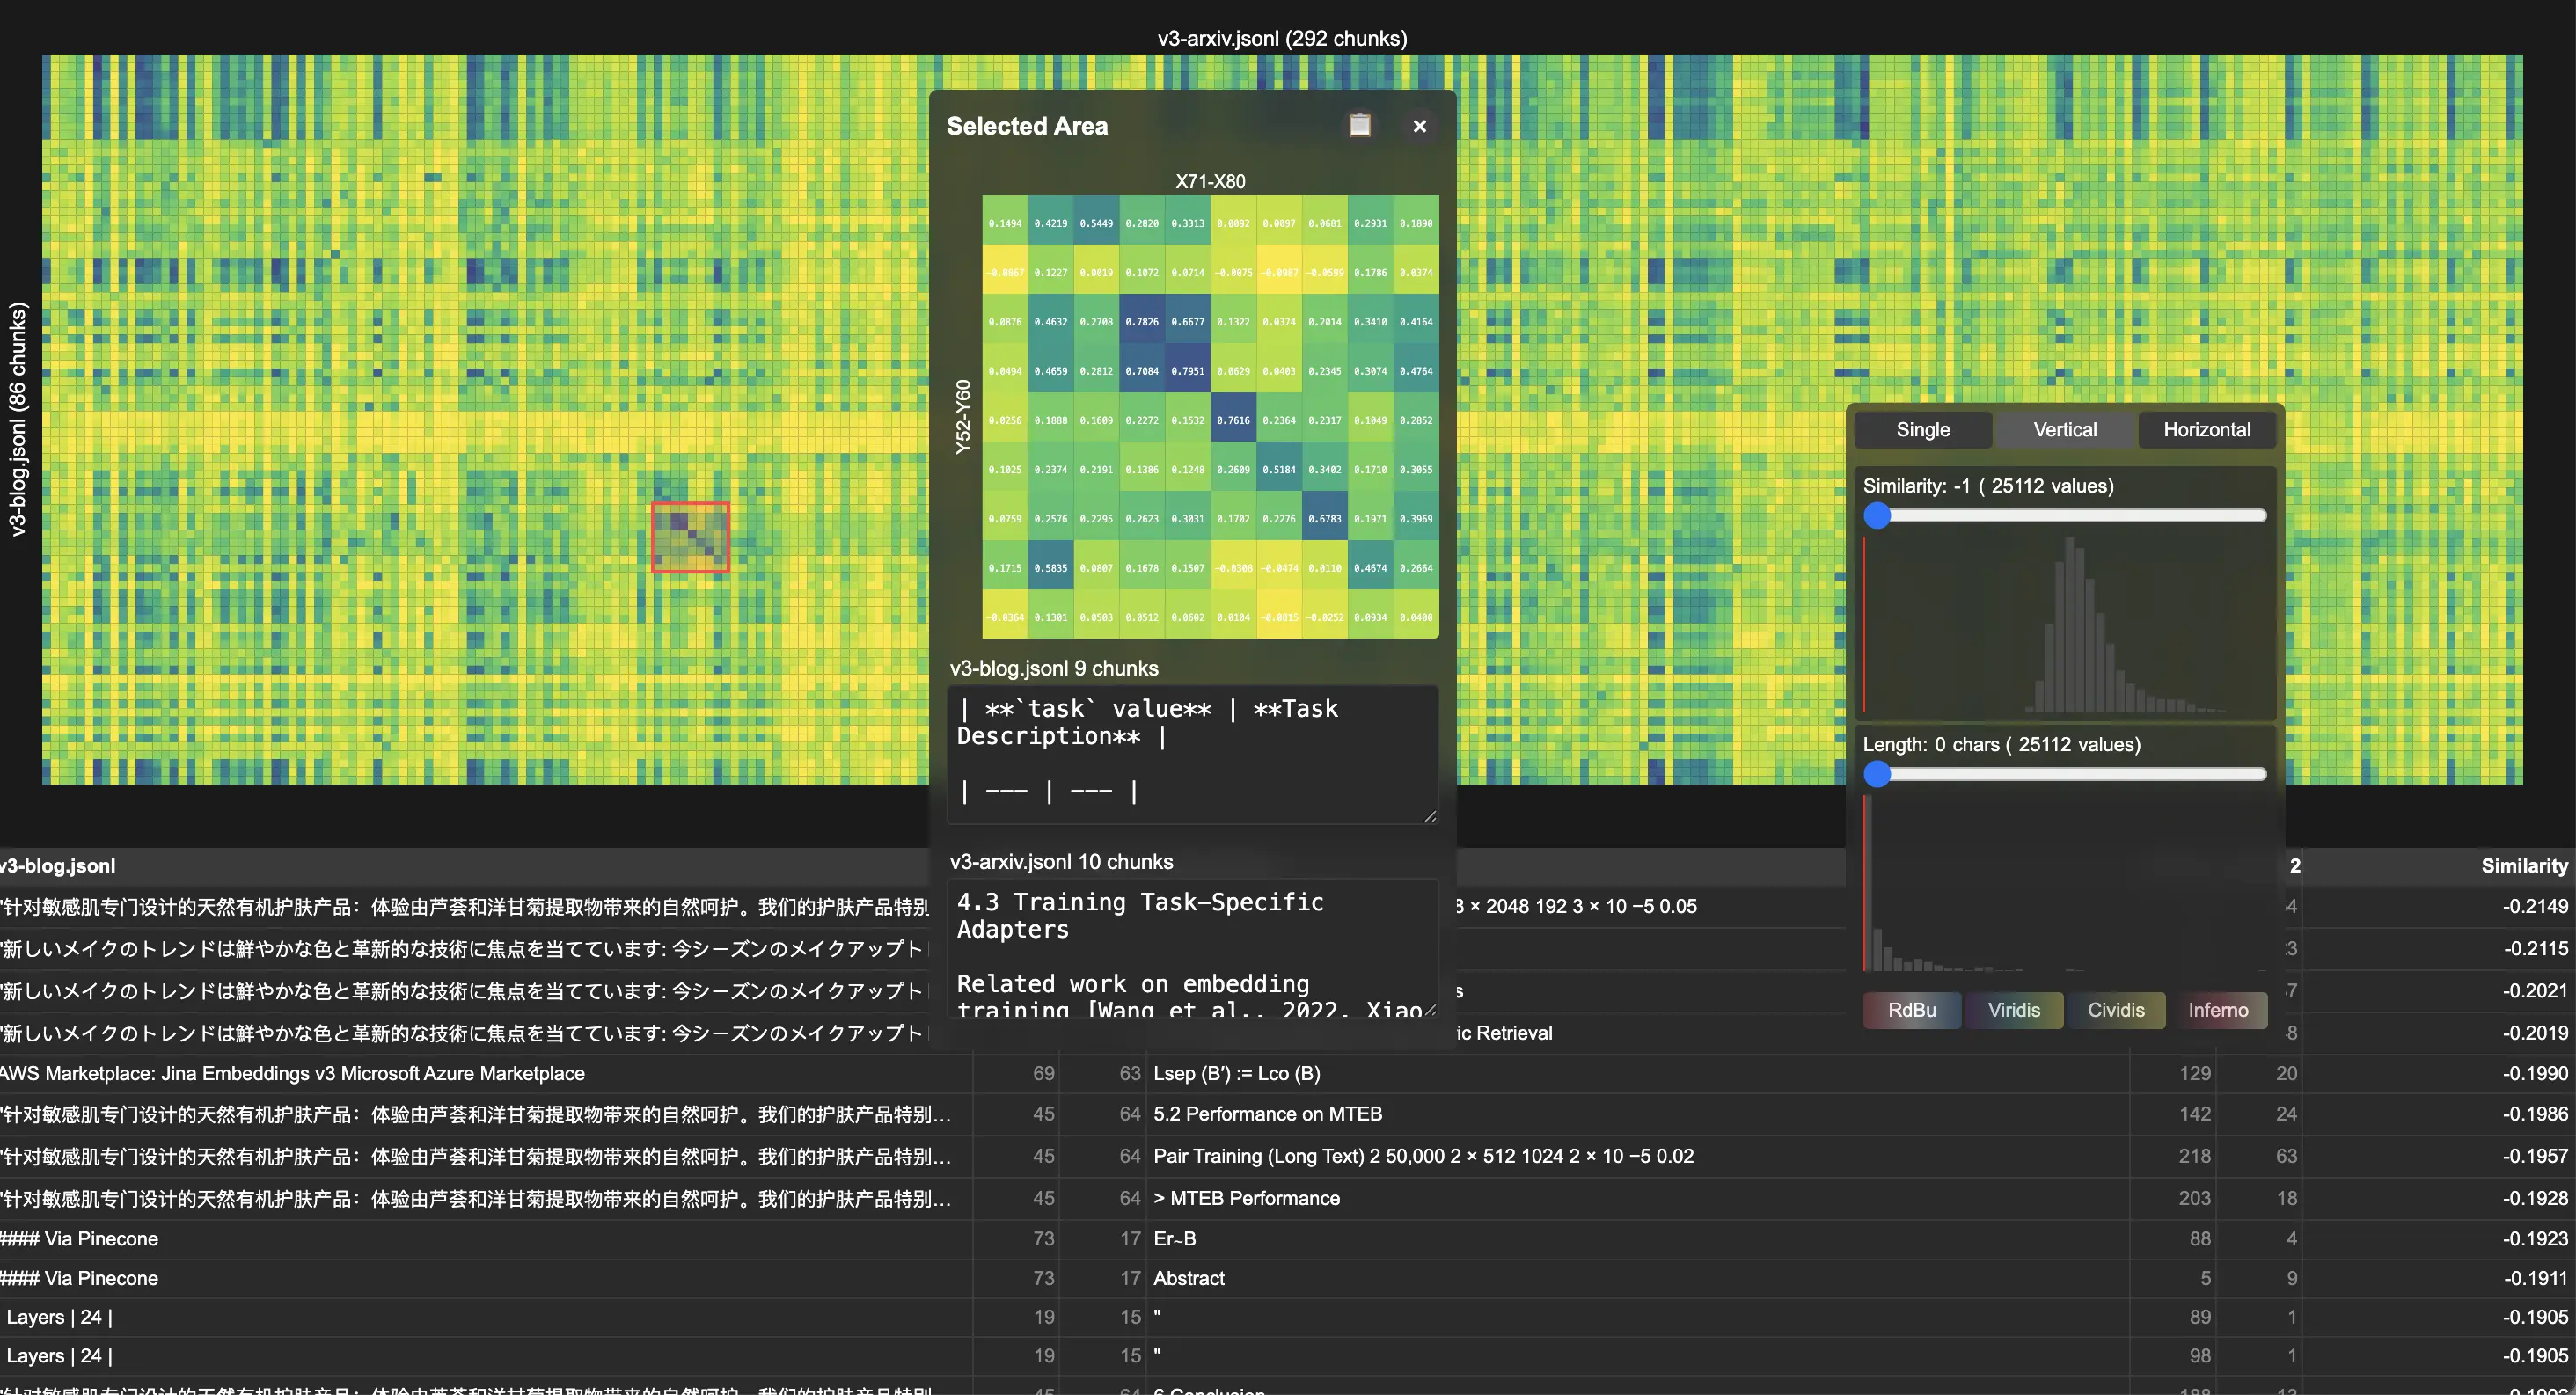
Correlations generates interactive heatmaps where each cell shows the cosine similarity between two pieces—whether they're chunks from the same or different document collections, modalities, hyperparameters, or models. It supports several interaction:
- Hover inspection: Original text/image and similarity scores for individual cell pairs
- Region selection: Interactive area selection for focused analysis of similarity patterns
- Threshold filtering: Similarity score and text length filters to reduce noise
The tool operates via a two-stage pipeline:
npm run embed: Using the Jina Embeddings API with configurable chunking strategies (newline, punctuation, character-based, or regex patterns)npm run corr: Browser-based UI serving correlation heatmaps with real-time interactivity
To get started:
npm install
export JINA_API_KEY=your_jina_key_here
npm run embed -- https://jina.ai/news/jina-embeddings-v3-a-frontier-multilingual-embedding-model -o v3-blog.jsonl -t retrieval.query
npm run embed -- https://arxiv.org/pdf/2409.10173 -o v3-arxiv.jsonl -t retrieval.passage
npm run corr -- v3-blog.jsonl v3-arxiv.jsonlJINA_API_KEY is used for embedding and reading content from a URL when necessary, reading from local text file is of course supported. You can also bring your own embeddings and do npm run corr for visualization only, in which case you don't need JINA_API_KEY. The tool supports both self-correlation analysis (within a single collections) and cross-correlation analysis (between two collections).
tagUse Cases
tagContent Deduplication and Alignment Analysis
We demonstrate the tool's utility through analysis of our jina-embeddings-v3 publications. By comparing the academic paper with the release note, the visualization revealed distinct diagonal patterns in the correlation heatmap, indicating strong chunk-to-chunk alignment between documents. Detailed examination showed systematic content reuse, particularly in technical sections describing LoRA task types.
tagCitation and Reference Validation
The tool proves valuable for validating citation accuracy in retrieval-augmented generation systems, where it becomes critical to verify that retrieved passages genuinely support generated claims. Similarity-based analysis is a powerful and intuitive tool for exploring large data sets, for instance, for revealing patterns by grouping items by similarity.
tagChunking Strategy Exploration
Late chunking and other segmentation strategies can be evaluated by examining how different approaches affect semantic coherence within and between text segments. The visualization helps identify the late chunking effect and the optimal chunk boundaries by revealing similarity patterns that align with semantic structure.
tagCross-Modal Analysis
The tool extends beyond text to support image embeddings via jina-clip-v2, enabling analysis of text-image correlation patterns for multimodal applications.
tagRelated Work in Embedding Visualization
The interpretability challenge is particularly acute when working with high-dimensional embeddings. The landscape of embedding visualization techniques has evolved significantly, with different approaches can be categorized as:
- Dimensionality Reduction-Based: Traditional approaches using PCA, t-SNE, UMAP that project high-dimensional spaces to 2D/3D
- Interactive Exploration-Based: Tools like Parallax and TextEssence that enable direct manipulation and exploration
- Domain-Specific Solutions: Specialized tools like Clustergrammer for biological data
- Direct Similarity Visualization: Our approach and similar heatmap-based methods that preserve full relational information
| Method | Approach | Use Cases |
|---|---|---|
| Correlations | Direct pairwise similarity heatmaps | Text similarity debugging, alignment analysis |
| Embedding Projector | PCA, t-SNE and custom linear projections | Interactive visualization and interpretation |
| Parallax | Algebraic formulae for semantic exploration | Understanding semantic relations |
| TextEssence | Comparative corpus analysis | Diachronic analysis, corpus comparison |
| Nomic Atlas | Cloud-based scalable visualization | Large-scale datasets, collaboration |
| Clustergrammer | Interactive heatmap with clustering | High-dimensional biological data |
| t-SNE | Non-linear cluster visualization | Model debugging, confusion identification |
| UMAP | Local and global structure preservation | Medium-large datasets, general analysis |
| PCA | Linear dimensionality reduction | Initial exploration, baseline comparison |
tagLimitations of Point-Wise Approaches
Existing visualization tools primarily focus on point-wise representations in 2D spaces, which can lose critical information about pairwise relationships. Moreover, most tools are designed for single embedding space analysis rather than comparative evaluation between different sources, modalities or embedding strategies (e.g. late chunking on vs. off).
For example, we recently encountered two use cases at Jina. The first involves cross-checking citations in DeepSearch, where we need to match generated report to the original excerpts from the reference material. The second is multimodal retrieval, where we need to verify image-text and image-image alignment on new unlabeled data. In both cases, we need to explore the relationships between two collections of embeddings. So we use Correlations to get a sense of how well the matches align and to validate whether the highest correlations consistently correspond to the correct matches.
tagConclusion
Beyond vibe checking, correlations can provide deeper insights into semantic relationships. As a starting point, several key statistics can be extracted from the correlation matrix:
- Matrix Density: The proportion of correlations above specified thresholds, indicating overall semantic cohesion
- Eigenvalue Distribution: Principal components analysis reveals the dominant patterns in similarity structure
- Matrix Rank: Indicates the effective dimensionality of the similarity relationships
- Condition Number: Measures numerical stability and potential multicollinearity issues
Advanced analysis may also involve extracting meaningful submatrices that represent coherent semantic regions. Extracting k-order maximal-sum principal submatrix from an n-order real matrix is a typical combinatorial optimization problem that can identify the most highly correlated segments.


